San Francisco November Market Update
Manuel Solis November 23, 2020
Real Estate

Manuel Solis November 23, 2020
Real Estate
Welcome to our November newsletter. This month, we take a look at the ways in which current U.S. economic conditions are affecting local, state, and national real estate markets. In particular, we examine some crucial economic indicators, such as third-quarter Real Gross Domestic Product (GDP)1 and new housing permits. Although California’s COVID-19 cases remain fewer per capita than those of most other states, cases are rising in California, and the United States as a whole is seeing new peaks every day. Even amidst this uncertainty, demand for homes has never been higher. Mortgage rates continue at all-time lows, and buyers are devoting more of their total spending to housing costs. As we make our way through the autumn months, we continue to provide you with the most up-to-date market information so that you feel supported and informed in your buying and selling decisions.
In this month’s newsletter, we cover the following:
Key Topics and Trends in November
In this issue, we dive into some key economic indicators that tend to affect long-term home prices. GDP and employment together explain much of the economic climate and typically trend with housing prices, but they do not explain the current rise in home prices. We will still go over the ins and outs of these indicators, however, because they have received so much press and may affect home prices in the future.
The U.S. Bureau of Economic Analysis reported a 7.4% third-quarter gain to GDP, which is the broadest measure of goods and services produced. During the second quarter of 2020, GDP dropped 9.5% quarter-over-quarter. The second-quarter drop was so sharp that the third-quarter bounce was expected. The long-term effects of the initial drop, however, have yet to be seen. Economists expect lower fourth-quarter GDP growth, which will not make up all the ground lost in the second quarter. Ultimately, the loss in GDP will likely be permanent.
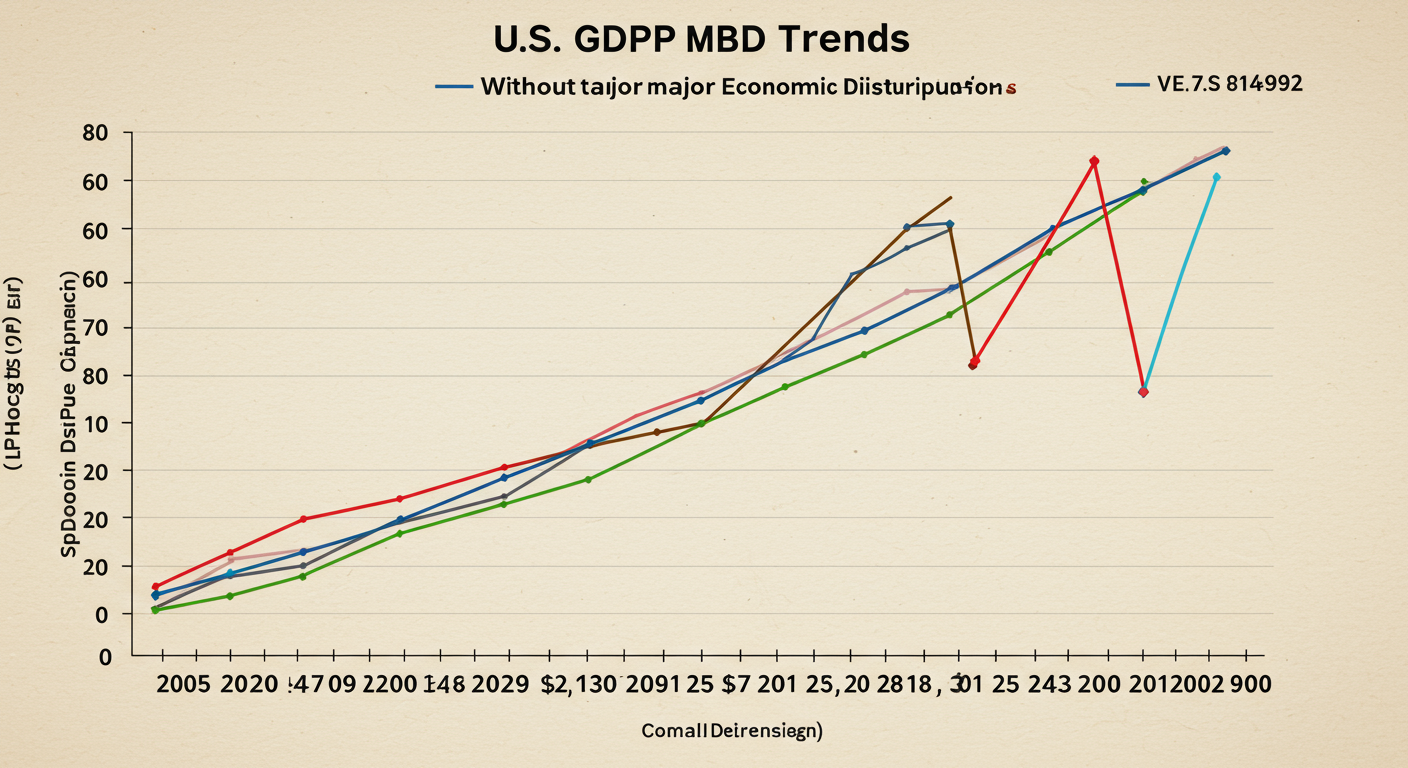
The chart below illustrates the cost of a recession. While it depicts U.S. GDP from 2005 to present, it illustrates economic patterns that occur in all recessions. GDP tends to grow at a fairly consistent rate during economic expansions. The dotted line in the chart represents the predicted GDP had the 2008 financial crisis never happened, and the green line illustrates the expected third-quarter 2020 GDP had the pandemic never happened. As that green line shows, we are 40% below where GDP was expected to be this fourth quarter. In other words, we are still underwater despite the impressive third-quarter 2020 increase in GDP.
The employment level does matter in the long term, particularly for the housing market. Disposable personal income and savings, which both dropped in the third quarter, are two of the most important factors when considering whether or not to buy a home. As a result, we will continue to monitor these numbers.
Despite suboptimal major indicators, housing prices have risen considerably. Nationally, home prices have never been higher, and the high demand for single-family homes has dropped the Months of Supply Inventory to the lowest level ever, according to the National Association of Realtors. Months of Supply Inventory is an important marker of real estate market health because it measures how many months it would take for all current homes for sale on the market to sell at the current rate of sales. Low Months of Supply Inventory means that there is a high demand for homes that will push prices higher more rapidly.
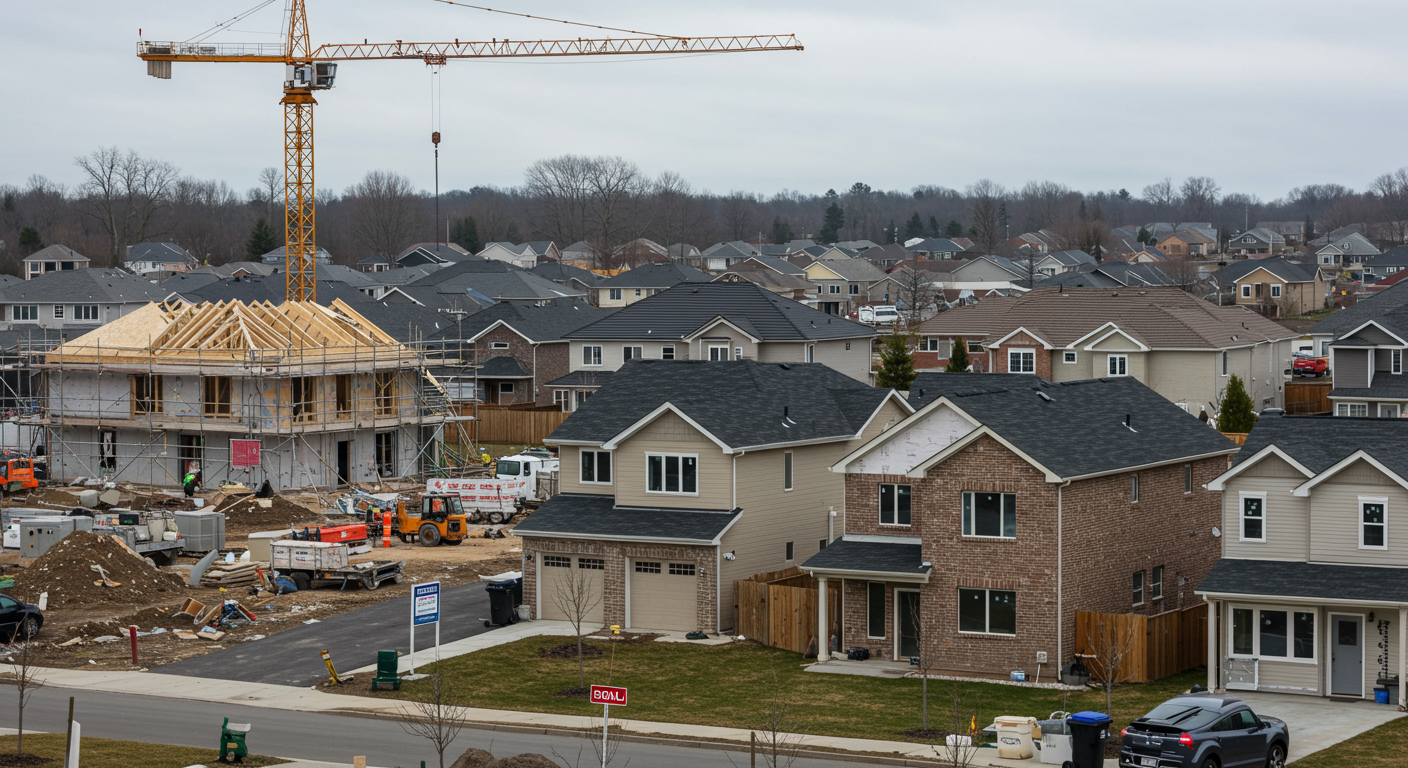
Not only are sales of existing homes up, but so are home building permits. The number of home building permits is the highest it’s been since the housing bubble burst in 2006.
The rise in housing demand and price under the current economic scenario speaks to three factors: (1) the asymmetric effect of the pandemic on personal income; (2) monetary policy (low interest rates); and (3) buyer preference. Many people have not experienced negative financial effects from the pandemic. An average person who did not lose their job may have even gained financially through a decrease in expenses. Less opportunity for travel, entertainment, and leisure activities could result in an increase in savings. At the same time, mortgage rates are historically low (2.78% as of November 5, 2020) and will remain low for the foreseeable future, making financing higher-priced homes more affordable. And finally, because so much time is currently being spent at home, buyers are willing to use more of their income to create nicer living spaces, buying larger homes, luxury furniture, and new appliances.
In both the short and long terms, housing is one of the best investments one can make.
November Housing Market Updates for San Francisco
We expect the San Francisco single-family home and condo markets to continue their different trends through the autumn and winter months. The two markets diverged in July because the buildup of condo inventory caused the largest median condo price decline this year.
In October, the median single-family home price slightly retracted year-over-year, with a median home price of $1.63 million. The median condo price continued to see the effects of excess supply, with the median dropping to $1.2 million.
Total inventory decreased slightly in October because the number of sold homes rose, while new listings decreased. Lack of supply compared to demand typically buoys San Francisco’s prices. Even though it might not feel like it, this is still the case for single-family homes. Single-family home inventory is noticeably higher, but it is still low relative to demand.
The number of condos on the market remains high in absolute and historical terms. The drop in condo prices is consistent with the runup in supply. The large supply of condos has successfully given buyers a greater opportunity to find the right home for them, which we can see by the number of homes sold. Supply, however, is simply outpacing demand. With the current supply of condos, the market cannot support the prices seen pre-pandemic. This trend is likely to continue, as new listings are still coming to market and inventory remains near historic highs.
Home sales have climbed since the initial months of the pandemic (March through May). Generally, buyers and sellers left the market in April and May, causing pent-up demand. In October, sales increased and are at or near the highest level this year for single-family homes and condos. Usually, we expect sales to decline in the autumn and winter months, but this year’s summer selling season was delayed and seems to be spilling into autumn.
The increases in inventory and sales have created more efficiency in the market. San Francisco is known for homes selling well above list. While this has become the norm in San Francisco, it remains atypical nationally. Because San Francisco has been so undersupplied, buyers have been incentivized to offer the highest bids for the houses they love. The increased inventory San Francisco is currently seeing gives buyers more options, meaning they are no longer forced to offer huge amounts over list prices. Single-family homes are not commanding as large of a premium as they were pre-pandemic, and condos are even selling below list.
In summary, the high inventory levels have made the condo market favor buyers. The single-family home market, however, once again favors sellers in San Francisco. Overall, the housing market has shown its resilience through the pandemic and remains one of the safest asset classes. Economic indicators are in an anomalous state, meaning that they are out of trend with each other. The data show that housing has remained consistently strong through this period.
We anticipate new listings to slow until excess inventory lowers. Single-family home prices will likely remain stable with no outsized gains or losses through the winter months. The median condo price will likely continue to decline. The autumn/winter season tends to see a slowdown in activity, although we may see a new trend this year with higher-than-normal sales.
As always, we remain committed to helping our clients achieve their current and future real estate goals. Our team of experienced professionals are happy to discuss the information we have shared in this newsletter. We welcome you to contact us with any questions about the current market or to request an evaluation of your home or condo.
Recent
Browse our blog posts to be in the know.


Provided Courtesy of Ascend Real Estate

Provided Courtesy of Ascend Real Estate

Provided courtesy of Ascend Real Estate


Welcome to our September newsletter, where we’ll discuss residential real estate trends in the East Bay and across the nation. This month, we’ll examine the state of t… Read more


The Big Story What to expect when you’re expecting inflation Quick Take: The number of homes sold in 2021 is set to be one of the highest on record. Inflation reached … Read more


Welcome to our September newsletter, where we’ll discuss residential real estate trends in Silicon Valley and across the nation. This month, we’ll examine the state of… Read more


Welcome to our September newsletter, where we’ll discuss residential real estate trends in San Francisco and across the nation. This month, we’ll examine the state of … Read more


As we end another crazy year, we are very grateful our kids are finally fully vaccinated, and a return to some sense of normalcy is in view. We are especially looking … Read more


Summer is here, and so are the boozy slushies, all-you-can-eat tacos and double cheeseburgers


The Big Story Where can home prices go from here? Quick Take: Home prices appreciated faster in 2021 than at any other time, even surpassing the 2004–2006 housing bubb… Read more


No doubt 2021 Bay Area housing markets was one of the wildest in recent memory! Our local real estate experts will share their year-end analysis of San Francisco, East… Read more


Welcome, welcome, welcome to 2022. Low inventory here in San Francisco gave us Realtors® a short respite. I took advantage of the slowdown and spent some time tailgati… Read more

You’ve got questions and we can’t wait to answer them.