South Bay/Peninsula February Market Update
Manuel Solis February 24, 2021
Real Estate

Manuel Solis February 24, 2021
Real Estate
Welcome to our February newsletter. This month, we cover long-term trends in the United States, considering the ways in which history can inform our future. We also compare the 2020 and 2019 calendar years in our local area, using 2019 as a “normal” year to reflect upon 2020 trends.
We don’t want to jinx anything, but we may have turned the corner on the pandemic. New cases are declining after peaking in early January, and the United States is administering over 1 million vaccinations a day. Whether we are on the back side or not, COVID-19 will have lasting effects on how we live and work. In particular, the pandemic has substantially raised housing demand. Working from home, or at least working in non-office settings, is here to stay, and all-time-low mortgage rates have incentivized renters to enter the housing market because the cost of buying may be lower than renting. For these reasons, we suspect that demand will continue to remain high through 2021.
As we navigate an ever-changing economic landscape, we remain committed to providing you with the most up-to-date market information so you feel supported and informed in your buying and selling decisions.
In this month’s newsletter, we cover the following:
Key Topics and Trends in February
This month, we are taking a step back from discussing short-term trends so that we can dive into secular trends (trends that are neither seasonal nor cyclical) to help us understand the current housing environment. We use three metrics in the chart below—the ratio of single-family home starts (new construction)/single-family homes sold, Months of Supply Inventory, and average 30-year fixed mortgage rates—as they all provide insight into supply and demand. The first two metrics indicate levels of supply and demand. The ratio of single-family home starts to new single-family homes sold indicates the level of production versus demand, while Months of Supply Inventory (MSI) reflects the number of months it would take for the current inventory of homes on the market to sell given the current sales pace. The third metric, average 30-year fixed mortgage rates, shows the cost of financing a home.

1980-1995
The early 1980s marked the highest mortgage rates in the United States—over 18%—as well as the secular decline in rates since that peak. During the 16-year period between 1980 and 1995, the ratio of housing starts to homes sold stayed fairly stable, which is ideal in terms of equilibrium in supply and demand. However, MSI began to shift lower around 1990, indicating that demand was increasing relative to supply. We saw a small peak in MSI in 1995, which declined until the housing bubble began to burst in 2005. During this period, mortgage rates experienced the steepest drop, with an approximately 11% decline. The difference in mortgage payment from 18% to 7% equates to about $10,000 per month in savings on a $1 million mortgage, making homes much more affordable.
1995-2005
This period contained an economic growth cycle. Demand for housing dramatically increased, while the housing-starts-to-new-homes-sold ratio declined and MSI decreased and held at around four months of supply. Credit lending standards during this 11-year period were extremely lax while mortgage rates continued to decline, which further increased demand. Home prices more than doubled from 2000 to 2005. This period marked the beginning of the housing market decline and home appreciation deceleration.
2005-2020
Typically, MSI and the housing-starts-to-new-homes-sold ratio track together, but from 2005 to 2010, they started to show an inverse relationship. MSI rose, while the ratio declined. This happened because, with the Great Recession, demand and new production dropped precipitously and didn’t rebound until 2012. After 2012, the housing recovery began, and we experienced another stable state with fairly steady supply and demand dynamics and consistently low mortgage rates.
During the pandemic and the resulting recession in 2020, mortgage rates fell further, and demand increased dramatically. MSI dropped sharply in 2020 due to high demand and dwindling supply. Mortgage rates have never been lower, which incentivizes more people to enter the market.
The significance of the buying frenzies from 1995 to 2005 and during 2020 is best reflected in the homeownership rate, which also shows the lingering effects of the housing bubble. Home prices started increasing again in 2012, but the homeownership rate declined until 2016. From 2016 to 2020, about half of the homeownership increase occurred in the second quarter of 2020 alone.

It’s difficult to overstate just how unique homebuying trends were in 2020. The homeownership rate increased 2.6% over a single quarter. For reference, out of 223 quarters, only three other quarters had a change above 1%. This was a gigantic jump.

Although we do not expect the same level of buying in 2021, the environment is right for sustained high demand. Supply remains low, and we anticipate a competitive landscape for buyers over the course of this year.
February Housing Market Updates for Silicon Valley
The median single-family home price rose, and condo prices fell slightly month-over-month. Year-over-year, single-family home prices rose considerably while condo prices showed price stability.

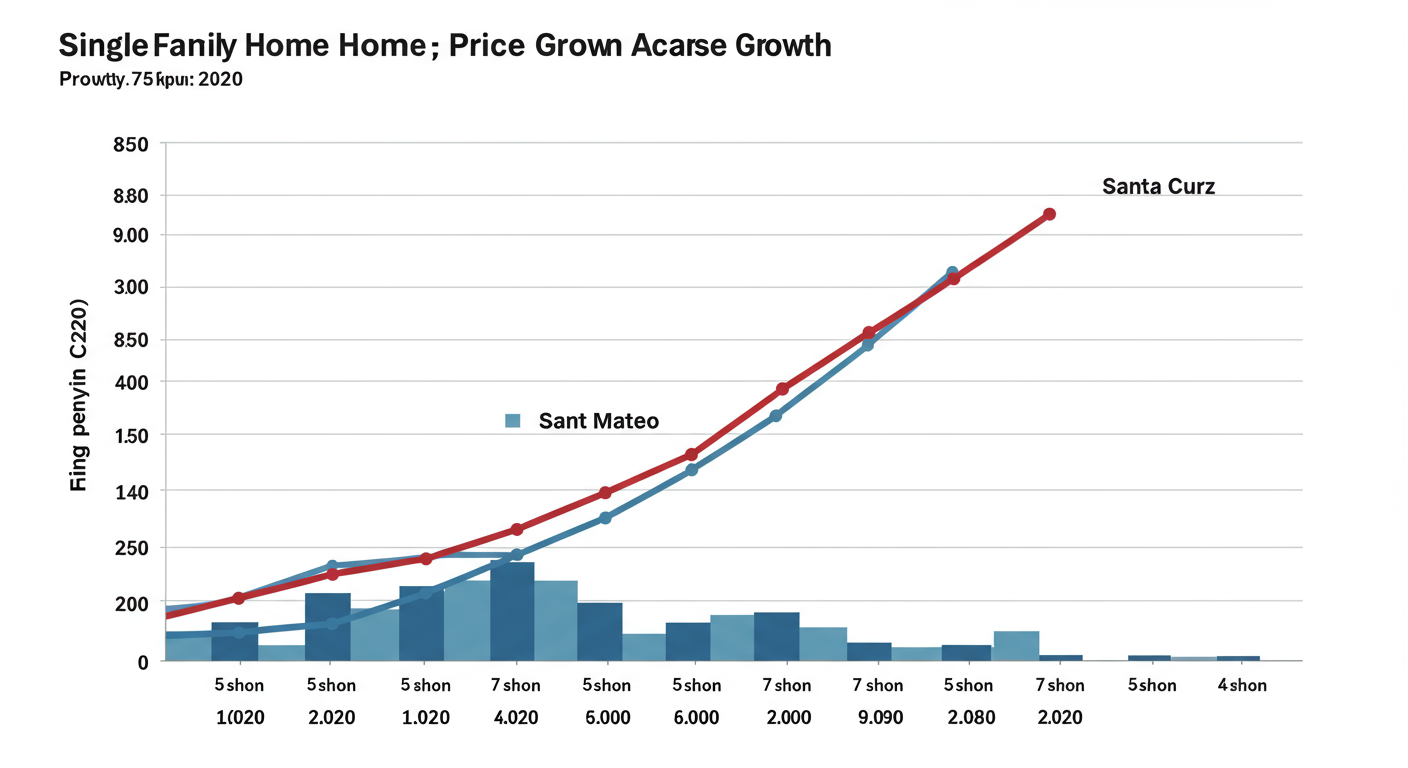
Across counties, Silicon Valley single-family home prices rose throughout 2020.

The three counties closed out 2020 up 15% in San Mateo, 12% in Santa Clara, and 20% in Santa Cruz.
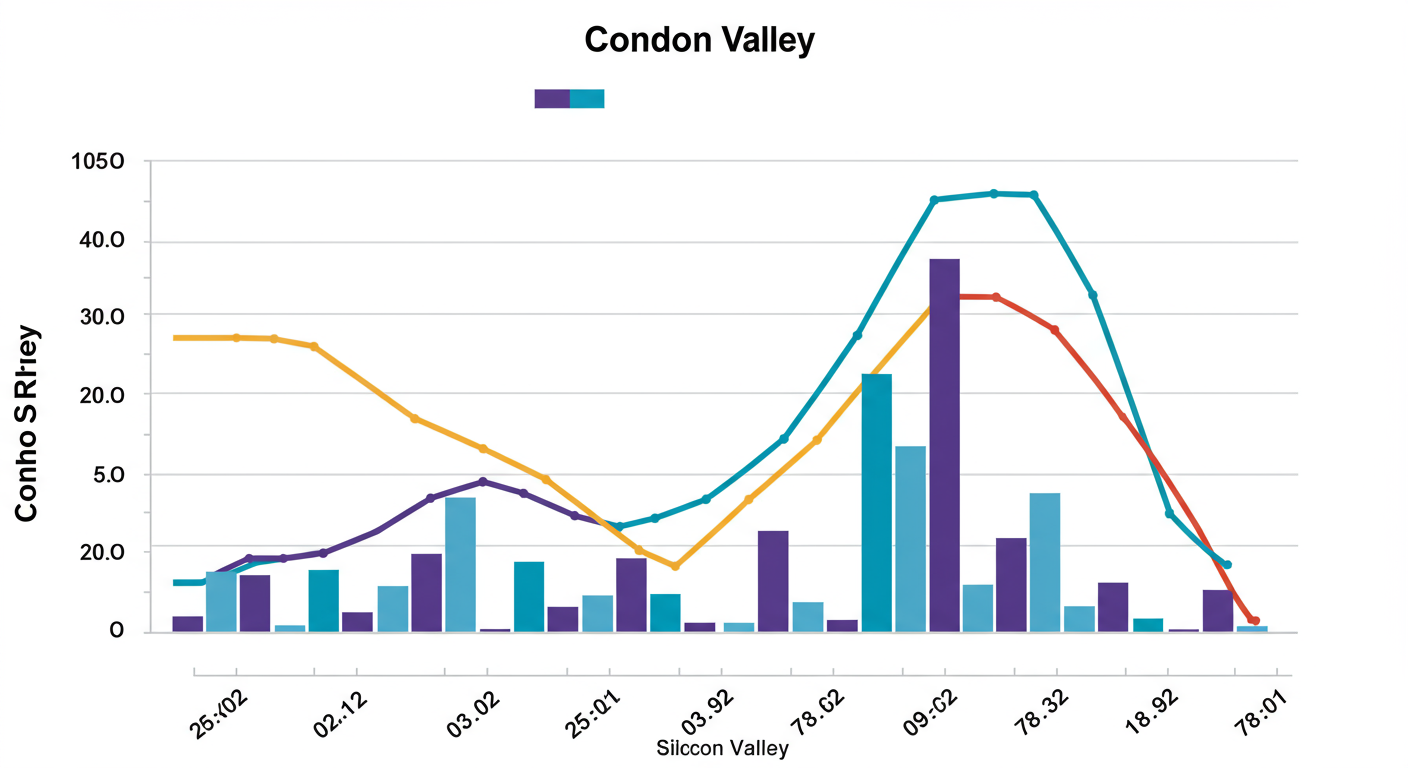
As you can see in the graph below, median condo prices were mixed across counties. San Mateo condo prices are significantly lower than last year, while Santa Clara and Santa Cruz condo prices rose.
Single-family home inventory remained at a lower level through 2020 relative to 2019, which speaks to the desirability of Silicon Valley. During the pandemic, fewer people wanted to leave, and more people wanted to move to the area. New listings throughout the year were lower than normal, while sales were higher. By the end of 2020, sales remained steady as new listings declined. With such a consistent level of demand, prices will likely continue to appreciate throughout 2021.

The number of condos on the market declined significantly in December. New condos coming to market outpaced sales every month in 2020 except for December, when sales rose far higher than new supply.

Days on Market (DOM) declined further for single-family homes throughout 2020, but both single-family homes and condos spent far less time on the market in December 2020 than they did in December 2019. As we will see, the pace of sales has contributed to the low MSI over the past several months.


We can use MSI as a metric to judge whether the market favors buyers or sellers. The average MSI is three months in California (far lower than the national average of six months), which indicates a balanced market. An MSI lower than three means that buyers dominate the market, and there are relatively few sellers (i.e., it is a sellers’ market), while a higher MSI means there are more sellers than buyers (i.e., it is a buyers’ market). The MSI dropped further in December 2020 to 0.6 months of supply for single-family homes and 1.4 months of supply for condos, both of which firmly favor sellers.


In summary, the high demand present in the Silicon Valley area has buoyed home prices. Inventory for single-family homes and condos will likely decline further this year, and fewer sellers will likely come to market, potentially lifting prices higher. Overall, the housing market has shown its resilience through the pandemic and remains one of the most valuable asset classes. The data show that housing has remained consistently strong through this period.
We anticipate new listings to slow until around March 2021. While the winter season tends to see a slowdown in activity, December 2020 showed higher-than-normal sales despite lower-than-normal inventory, once again highlighting the desirability of Silicon Valley.
As always, we remain committed to helping our clients achieve their current and future real estate goals. Our team of experienced professionals are happy to discuss the information we’ve shared in this newsletter. We welcome you to contact us with any questions about the current market or to request an evaluation of your home or condo.
Recent
Browse our blog posts to be in the know.


Provided Courtesy of Ascend Real Estate

Provided Courtesy of Ascend Real Estate

Provided courtesy of Ascend Real Estate


Welcome to our September newsletter, where we’ll discuss residential real estate trends in the East Bay and across the nation. This month, we’ll examine the state of t… Read more


The Big Story What to expect when you’re expecting inflation Quick Take: The number of homes sold in 2021 is set to be one of the highest on record. Inflation reached … Read more


Welcome to our September newsletter, where we’ll discuss residential real estate trends in Silicon Valley and across the nation. This month, we’ll examine the state of… Read more


Welcome to our September newsletter, where we’ll discuss residential real estate trends in San Francisco and across the nation. This month, we’ll examine the state of … Read more


As we end another crazy year, we are very grateful our kids are finally fully vaccinated, and a return to some sense of normalcy is in view. We are especially looking … Read more


Summer is here, and so are the boozy slushies, all-you-can-eat tacos and double cheeseburgers


The Big Story Where can home prices go from here? Quick Take: Home prices appreciated faster in 2021 than at any other time, even surpassing the 2004–2006 housing bubb… Read more


No doubt 2021 Bay Area housing markets was one of the wildest in recent memory! Our local real estate experts will share their year-end analysis of San Francisco, East… Read more


Welcome, welcome, welcome to 2022. Low inventory here in San Francisco gave us Realtors® a short respite. I took advantage of the slowdown and spent some time tailgati… Read more

You’ve got questions and we can’t wait to answer them.